Research Article | | Peer-Reviewed

Using Machine Learning Techniques to Predict Significant Wave Height Compared with Parametric Methods

Received: 10 September 2024     Accepted: 27 September 2024     Published: 18 October 2024
Views:       Downloads:
Abstract

Prediction of Sea Wave parameters is an important issue as it is the main design factor for maritime structures. Previously, researchers have used many parametric and numerical approaches, which may be complex in application, take a long time in preparation and sometimes require a bathymetric survey. Recently, soft computing techniques such as Fuzzy Inference Systems, Genetic Algorithm, Machine Learning, etc. have been used to predict sea wave parameters in many marine areas around the world. The ease of application, high accuracy and low computational time of these techniques make them a very good choice in many engineering applications. This study focuses on prediction of significant wave height (Hs) by applying one of the most advanced Machine Learning techniques known as Support Vector Machine (SVM). SVM models are built on the basis of different Kernel functions (Linear, Sigmoid, Radial Basis Function, and Polynomial) which transform the input data into an n-dimensional space where a hyperplane can be generated to partition the data. The results of SVM models are analyzed, evaluated and then compared with the results of commonly used parametric models (P-M, SPM, and CEM). This study shows that the P-M model has reliable and satisfactory results among all parametric models, as its statistical errors are close to those of SVM models (RBF and Polynomial), while all of them are identical in their correlation factors (0.999). Moreover, the parametric models (SPM and CEM) are more accurate in their results than the SVM models (Linear and Sigmoid). Also, this study confirms that the SVM models (RBF and polynomial) are the most accurate models overall, as they have the best generalization error among all models. Finally, it can be concluded that SVM models (RBF and Polynomial) are a promising technique in the sea wave height prediction and can be used as an economic and accurate alternative solution to other prediction models.

Published in Engineering and Applied Sciences (Volume 9, Issue 5)
DOI 10.11648/j.eas.20240905.12
Page(s) 106-128
Creative Commons

This is an Open Access article, distributed under the terms of the Creative Commons Attribution 4.0 International License (http://creativecommons.org/licenses/by/4.0/), which permits unrestricted use, distribution and reproduction in any medium or format, provided the original work is properly cited.

Copyright

Copyright © The Author(s), 2024. Published by Science Publishing Group

Keywords

Sea Wave Parameters, Machine Learning, Support Vector Machine, Kernel Functions, Parametric Models, Significant Wave Height

1. Introduction
Sea wave parameters are the dominant factor in the design of offshore and nearshore structures such as fixed offshore platforms, ports, breakwaters, etc. Therefore, reliability in the prediction of wave parameters has become very important. Several methods such as parametric, numerical, and soft computing have been used to predict sea wave parameters. Parametric methods are usually based on the dimensional analysis approach by determining the parameters affecting the generation of sea waves. These methods are still preferred for solving many practical engineering problems . Moreover, the performance of parametric and numerical methods depends on quantity and quality of the data used. Also, the data used in these methods require some prior model assumptions, such as linearity, homoscedasticity, and normality. These assumptions are not required in data mining and machine learning methods as described in statistical learning theory (Vapnik, 1995), which attempts to minimize the empirical risk of the model built over the data .
On the other hand, numerical methods are generally based on the spectral energy balance equation. Since numerical methods require a high amount of processor time as well as local bathymetric surveys, their implementation is not an easy task . It is worth mentioning that when there is a lack of information as well as limited experience and computational resources, data mining and machine learning approaches would be very good choices .
Recently, soft computing approach has become widespread in the prediction of sea wave parameters such as Fuzzy Inference System (FIS), Artificial Neural Network (ANN), Classification and Regression Trees (CART), Adaptive Network based Fuzzy Inference System (ANFIS), Genetic Programming (GP), and Support Vector Machine (SVM). Ease of the application, as well as less required computational time, has made these soft computing methods more suitable for wave modeling .
This paper demonstrates the use of the Support Vector Machine models based on different Kernel functions to predict the significant wave height in the southeastern Mediterranean Sea. Next, the comparison between SVM models and commonly used parametric models has been performed. Although the basics of Support Vector Machine were mainly developed by Vapnik (1995), it has recently gained popularity due to its great experimental performance .
The use of Support Vector Machine methods for wave parameters prediction has been described in the literature in several marine areas. Mahjoobi and Mosabbeb (2009) used support vector machine to predict significant wave height in Lake Michigan. The SVM results were compared with those of Artificial Neural Networks (ANN), Multi-Layer Perceptron (MLP) and Radial Basis Function (RBF) models. The results showed that SVM models outperformed all ANN models. They also concluded that SVM models require fewer parameters with much less computational time compared to ANN models .
Patil et al. (2011) compared the results of ANN and ANFIS models with those of SVM models. These models were developed to predict wave transmission of floating breakwater based on experimental model data conducted at the National Institute of Technology, India. Genetic algorithm (GA) was used to tune the SVM to find optimal SVM models as well as kernel parameters. It was concluded that the SVM model based on the b-spline kernel has higher accuracy than the ANN and ANFIS models. It was also concluded that SVM can be used as a fast and reliable solution in the prediction of wave transmission of floating breakwater, which makes SVM models an alternative solution to other models .
Elgohary et al. (2017) used machine learning based on support vector machine to predict significant wave heights off the coast of Alexandria, Mediterranean Sea, Egypt. Six SVM models with different kernel functions (Linear, Sigmoid, and Radial Basis Function) were performed to evaluate the wave height prediction performance based on different metocean parameter inputs. The results showed that the mean sea level pressure and air temperature were not effective factors in wave height prediction, while wind speed was the most effective factor. However, the fetch data was helpful in improving the accuracy of model results. This study also confirmed that the performance of SVM models based on radial basis function (RBF) was superior to SVM models based on linear and sigmoid .
Afzal et al. (2023) used different machine learning tools such as linear regression (LR), ANN and SVM to predict significant wave heights in Mehamn harbor, Norway. They concluded that the SVM model outperformed the LR and ANN models. Furthermore, the SVM model based on RBF kernel function was superior to the models based on other Kernel functions such as Laplacian, Inverse Multiquadric, Rational quadratic .
The organization of this paper is as follows; Section 2 explains methodologies for the prediction methods used in this work. Section 3 describes the study area, and the data used. Section 4 and 5 show the results and discussions, respectively. Finally, Section 6 summarizes and concludes this work.
2. Methodologies
2.1. SVM Methods
The first method that will be used to predict significant wave height in the study area is the Support Vector Machine. SVM is a supervised learning method commonly used for classification and regression purposes, as it is a relatively recent technique that has shown great promise in creating accurate models of many engineering problems. Using SVM requires an understanding of how they work. When training an SVM model, we need to make several decisions such as how to pre-process the data, which Kernel to use, and how to specify the Kernel parameters. In some cases, uninformed choices may lead to poor model performance .
Boser et al. (1992) suggested a technique to create nonlinear classifiers by applying the Kernel trick to maximize the margin of hyperplanes between datasets . However, a modern SVM based on Soft-Margin was developed by Cortes and Vapnik to solve the following optimization problem :
Minimize 12w2+i=1nεi (1)
Subjected to: yiw.xi+b1-εi
Where: w is known as the weight vector, xiR, b is called bias, yi+1,-1, (i = 1, 2, 3, ... n), εi is slack variable or relaxation factor (εi0) and C is penalty parameter (C>0).
The penalty parameter “C” is used to trade-off between the maximization of the margin and minimization of the regression error.
2.1.1. Kernel Functions
SVM models are built around a Kernel function that transforms the input data into an n-dimensional space where a hyperplane can be constructed to partition the data. The Kernel functions commonly used with SVM models are as follows :
Linear Kernel function (Homogeneous):
Kxi,xj=xixj (2)
Sigmoid Kernel function (Hyperbolic Tangent):
Kxi,xj=tanhγ xixj+r, for γ>0 (3)
Radial Basis Function Kernel (Gaussian):
Kxi,xj=e-γ xi-xj2, for γ>0(4)
Polynomial Kernel function (Inhomogeneous):
Kxi,xj=(γ xixj+r)d, for γ>0(5)
Where: Kxi,xj is the Kernel function and γ, r and d are the Kernel parameters.
2.1.2. Parameters Selection
The accuracy of SVM models mainly depends on good setting of the SVM parameters “C” and "εi" as well as the Kernel parameters "γ", “r” and “d”. It is worth mentioning that the penalty constant “C” is a positive infinite constant and that the choices of “C” and "εi" control the model complexity. For example, Mao et al. (2005) concluded that the penalty constant “C” equal to 1000 is generally appropriate for many tasks . On the other hand, Mahjoobi and Mosabbeb (2009) found that the penalty constant “C” equal to 100 is suitable for the prediction of wave height in Lake Michigan . Obviously, the choice of appropriate SVM parameters will differ from one location to another depending on the nature and characteristics of the data used. However, performing sensitive runs on the data used will also support us in determining the SVM parameters optimally.
In this study, the SVM parameters will be equal to 500 and 0.01 for the penalty parameter “C” and the slack variable "εi", respectively, while the Kernel parameters will be equal to 1.0, 5.0 and 3.0 for "γ", “r” and “d”, respectively. These parameters were selected for the study area based on several sensitive runs.)
2.2. Parametric Methods
The second method that will be used is based on parametric methods, which are still preferred in the prediction of wave parameters worldwide. Three parametric methods were used in this study: Pierson-Moskowitz (1964), Shore Protection Manual (1984), Coastal Engineering Manual (2008) . It should be noted that the use of parametric methods requires checks to verify limitations of the marine data used, i.e. fetch limited, duration limited, or fully developed sea. Many design cases require iteration between these methods and the averaged durations . However, these checks were performed by Salah (2017) who found that the fully developed Sea condition was the most effective way in the study area .
2.2.1. P-M Method
The Pierson-Moskowitz method (P-M) was established in 1964 based on selected wave measurements of data sets recorded by British meteorological ships during the period 1955-1960. To estimate the significant wave height for the fully developed sea condition, the following relationship is formulated from the Pierson-Moskowitz spectrum :
Hs=0.21u2g(6)
Where: Hs is the significant wave height (m), u is the wind speed (m/s) at 10 m (standard elevation), and g is the gravitational acceleration (m/s2).
2.2.2. SPM Method
This method was developed by Hasselmann et. al., (1973) based on an extensive data set collected during the Joint North Sea Wave Project (JONSWAP). For the fully developed Sea condition, the following parametric relationships were used to calculate the significant wave height :
gHsUA2=0.2433 (7)
UA=0.71(u)1.23(8)
Where: Hs is the significant wave height (m), UA is the wind stress factor (m/s), and u is the wind speed (m/s) at 10 m above the sea surface.
2.2.3. CEM Method
The Coastal Engineering Manual method (CEM) was created based on some adjustments of the SPM method. The Fully developed Sea equations for the significant wave height were formulated as follows :
gHsU*2=2.11*102(9)
U*=u*(CD)0.5 (10)
CD=0.0011.1+0.035*u(11)
Where: U* is the friction velocity (m/s), u is the wind speed at 10 m above the sea surface (m/s), and CD is the drag coefficient.
3. Study Area and Data Used
The wind and wave data used in this study were collected in the southeastern Mediterranean Sea from 01 January 2010 to 30 December 2012. These datasets were provided by the Egyptian Navy, Division of the Meteorological and Oceanographic. The location of the study area is shown in Figure 1.
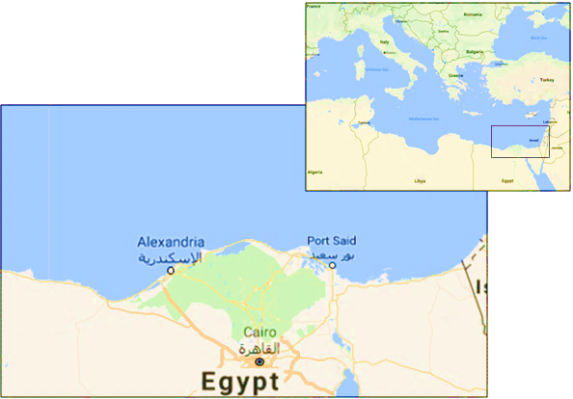
Figure 1. Location of the study area.
Datasets were based on data measured from S4DW buoys. The first one was at 31°10’60” N and 29°50’00” E off Alexandria, at water depth of 14 m, while the second one was at 31°51'00.6" N and 32°25'19.2" E off Port Said, at a water depth of 133 m.
3.1. The Importance of the Study Area
The offshore Nile Delta coast is considered one of the most promising regions in Egypt, which has high gas potential and condensate reserves for future exploration. Since most of the gas fields are concentrated off Alexandria and off Port Said (Figure 2), the study area has great economic importance for Egypt . Therefore, investigating different methods for predicting wave parameters has become very important, as it is a major factor in most activities related to marine projects.
3.2. Wave and Wind Characteristics
The analysis of wave data for the study area showed that about 80 % of significant wave height are between 1.6-1.8 m, and the corresponding significant wave period are between 7-8 second. The dominant waves are coming from the NW direction with an occurrence of 60 %.
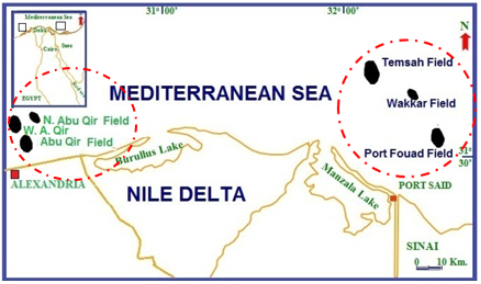
Figure 2. Locations of Gas field concentrations in the study area (in red dotted circle).
Figures 3 to 6 show the wind and wave data for Alexandria and Port Said (rose-shaped).
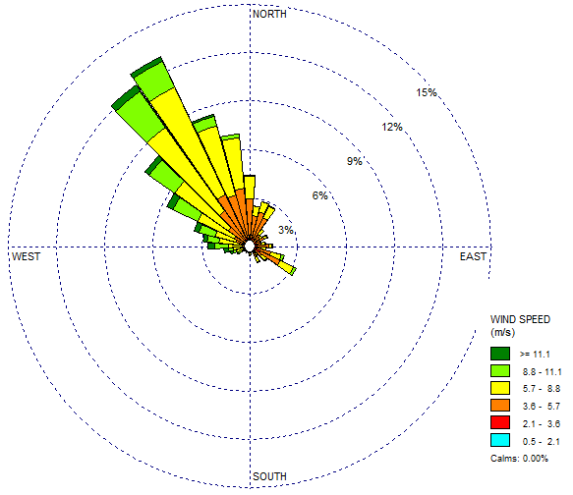
Figure 3. Alexandria Wind Rose data 2010 – 2012.
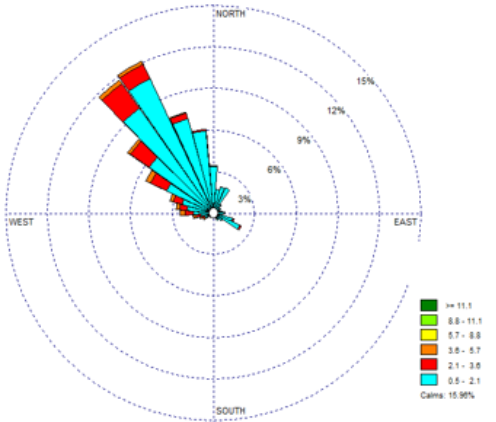
Figure 4. Alexandria Wave Rose data 2010 – 2012.
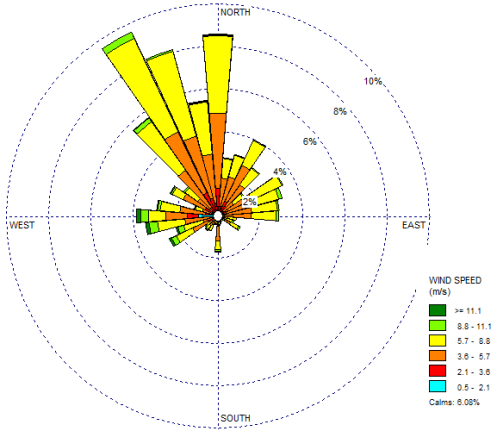
Figure 5. Port Said Wind Rose data 2010 – 2012.
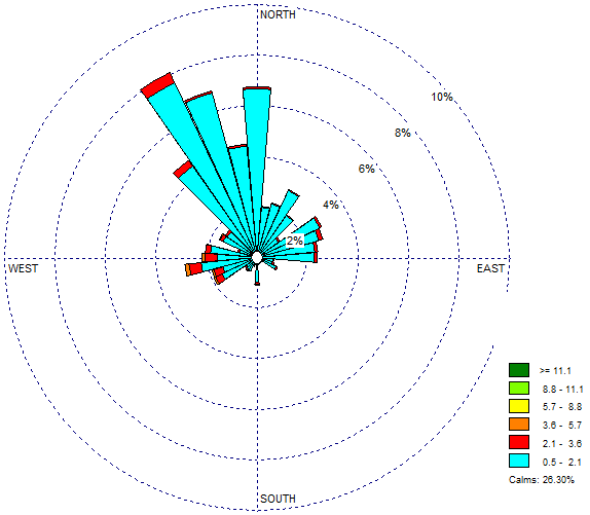
Figure 6. Port Said Wave Rose data 2010 – 2012.
4. Results
4.1. Models’ Accuracy
The In this study, three measures were used to evaluate the accuracy of models: Correlation Coefficient (R), Mean Square Error (MSE), and Scatter Index (SI), which are as follows:
R= i=1n Pi-P̅Oi-O̅i=1nPi-P̅2i=1nOi-O̅2   (12)
MSE= 1ni=1nPi-Oi2   (13)
SI= RMSE O̅(14)
Where:  Oi represents the observation value, Pi represents the predicted value, n is the total number of observations, P̅ is the mean of Pi, O̅ is the mean of  Oi, and RMSE is the Root Mean Square Error.
4.2. SVM Model Results
Four SVM models were performed using the data of the study area. These models were based on Linear, Sigmoid, RBF, and Polynomial Kernel functions. All SVM models were applied in the Port Said and Alexandria regions separately.
A comparison between observed and predicted values for each SVM model was performed separately. After that, a comparison was made between these models. Table 1 shows the error statistics of the observed and predicted Hs based on the different SVM models.
Table 1. Statistical errors of observed and predicted significant wave height using different SVM models.

SVM Models

Alexandria Region

Port Said Region

R

MSE (m)

SI (%)

R

MSE (m)

SI (%)

Linear

0.968

0.054

21.04

0.963

0.032

20.45

Sigmoid

0.967

0.058

22.08

0.962

0.036

21.13

RBF

0.999

0.00001

00.25

0.999

0.0003

2.10

Polynomial

0.999

0.001

2.14

0.999

0.00001

0.42

4.3. Parametric Model Results
On the other hand, three parametric models P-M, SPM, and CEM were conducted using the data of the study area. These models were applied in the Port Said and Alexandria regions. The performance of these models was evaluated as shown in Table 2, which displays all error statistics between observed and predicted Hs for all models in each region separately.
Table 2. Statistical errors of observed and predicted significant wave height using different parametric models.

Parametric Models

Alexandria Region

Port Said Region

R

MSE (m)

SI (%)

R

MSE (m)

SI (%)

P-M

0.999

0.02

12.3

0.999

0.01

11.4

SPM

0.994

0.31

43.2

0.994

0.09

29.6

CEM

0.998

0.07

22.7

0.998

0.02

15.1

5. Discussion
5.1. SVM Models
Table 1 showed that the correlation factor (R) with Linear and Sigmoid models ranges from 0.962 to 0.968 in the study area, indicating a strong correlation between the predicted and observed values.
Figures 7 to 10 illustrate the correlation charts between the actual values (observed) and the predicted values of Hs for Linear and Sigmoid SVM models.
Although the accuracy of the results decreases with Linear and Sigmoid models when the Hs > 2.5 m (Figures 7 to 10), it is still within the acceptable range as about 90% of the data of the study area are less than or equal to 2.5 m. In addition, the low values of MSE (m) and SI% listed in Table 1 confirmed that Linear and Sigmoid models have good performance with reasonable statistical errors. However, when using Linear and Sigmoid SVM models with Hs more than 2.5 m, there is an increase in the predicted values of Hs by about 15% ~ 35% compared to the observed values.
Also, Table 1 showed that the correlation factor (R) is 0.999 with RBF and Polynomial models for Alexandria and Port Said regions, indicating the correspondence between the predicted and observed values. Figures 11 to 14 illustrate the correlation charts for RBF and Polynomial SVM models. These Figures showed that most of predicted and observed Hs values lie on the diagonal Fit line, which indicates the high performance of these models with all Hs values.
The results in Table 1 confirmed that the SVM models based on RBF and Polynomial Kernels gave the best performance among all SVM models, as they have the lowest statistical errors.
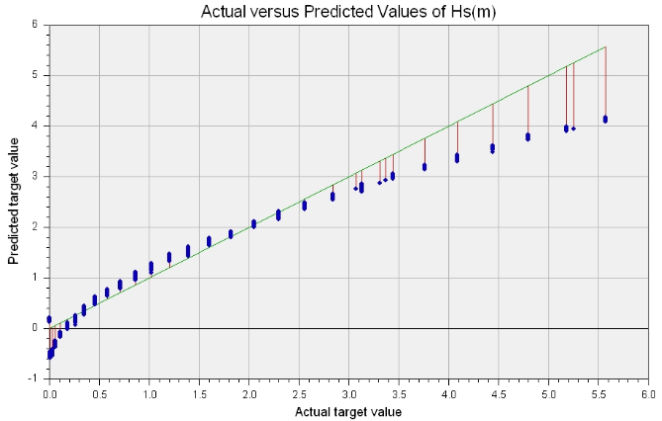
Figure 7. Correlation of Predicted and Actual Hs, Linear Model for Alexandria region.
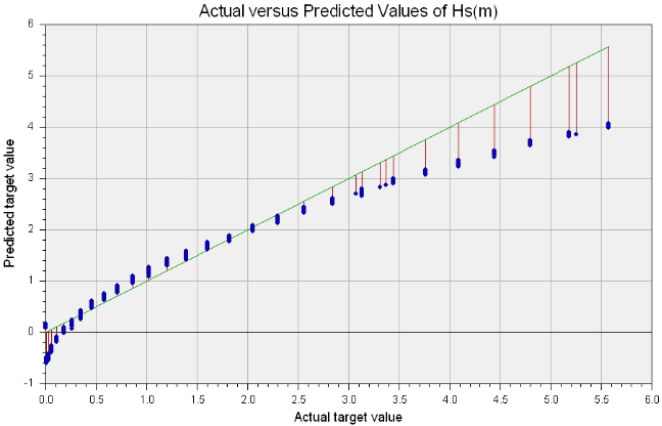
Figure 8. Correlation of Predicted and Actual Hs, Sigmoid Model for Alexandria region.
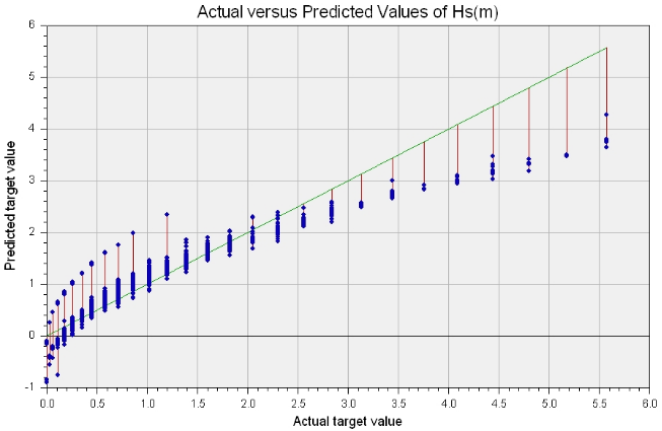
Figure 9. Correlation of Predicted and Actual Hs, Linear Model for Port Said region.
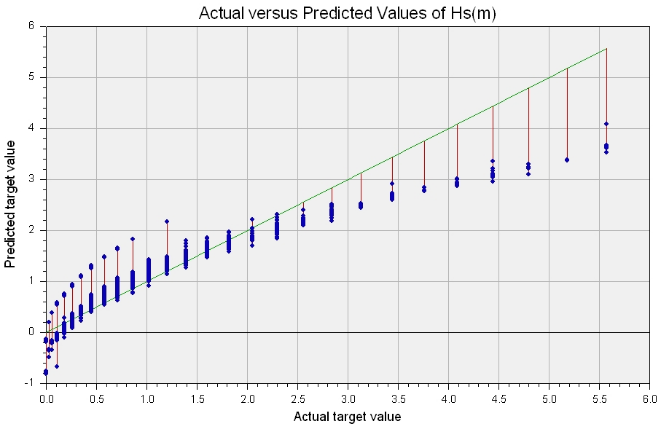
Figure 10. Correlation of Predicted and Actual Hs, Sigmoid Model for Port Said region.
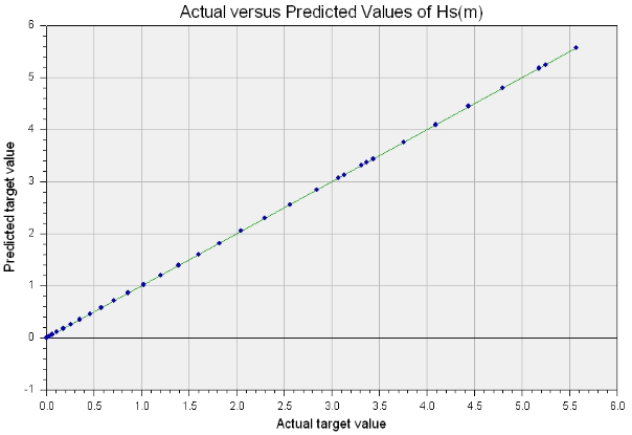
Figure 11. Correlation of Predicted and Actual Hs, RBF Model for Alexandria region.
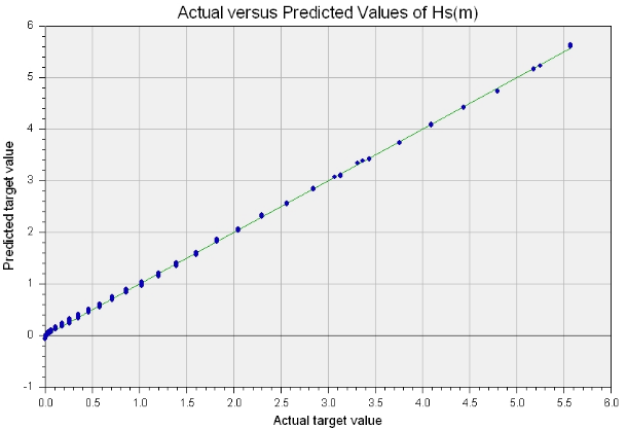
Figure 12. Correlation of Predicted and Actual Hs, Polynomial Model for Alexandria region.
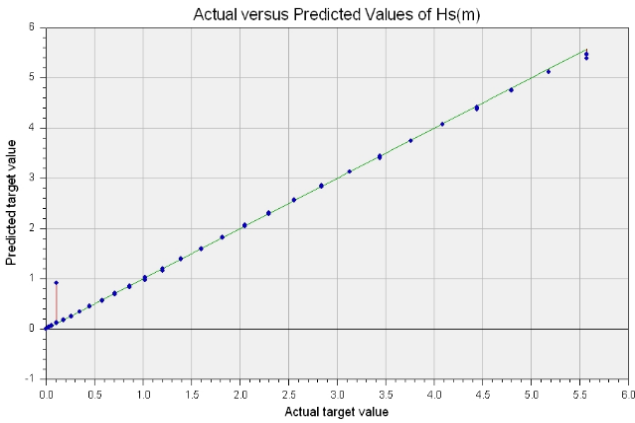
Figure 13. Correlation of Predicted and Actual Hs, RBF Model for Port Said region.
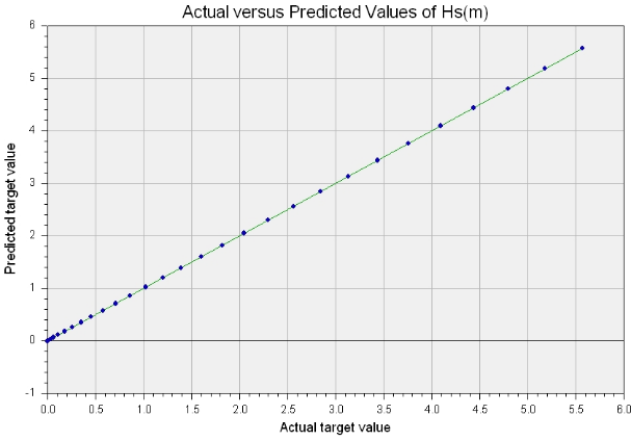
Figure 14. Correlation of Predicted and Actual Hs, Polynomial Model for Port Said region.
Figures 15 to 18 show the comparison of statistical errors for all Support Vector Machine models used in the study area.
The RBF model demonstrated superior performance in the Alexandria region, yielding lower Mean Square Error (MSE) of 0.00001 m and a smaller Scatter Index (SI) of 0.25 %, compared to the Port Said region where the MSE was 0.0003 m and SI was 2.10 %. Conversely, the Polynomial model exhibited better results in the Port Said region, with an MSE of 0.00001 m and SI of 0.42 %, whereas in the Alexandria region, the MSE was 0.001 m and SI was 2.14 %.
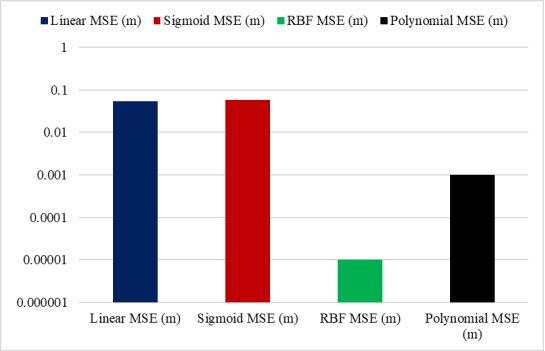
Figure 15. Comparison between the MSE (m) of predicted and observed Hs for all SVM Models (Alexandria region).
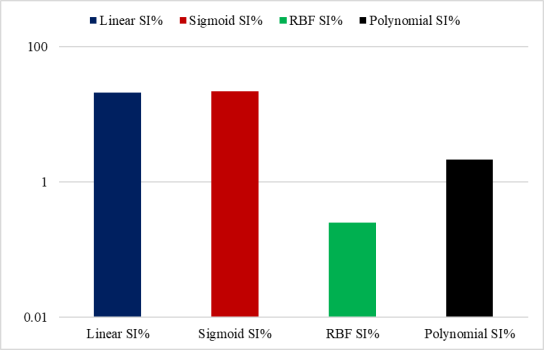
Figure 16. Comparison between the SI (%) of predicted and observed Hs for all SVM Models (Alexandria region).
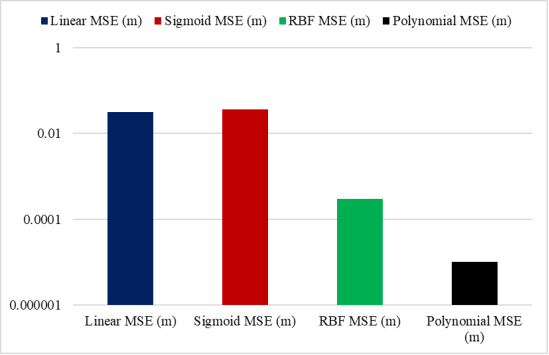
Figure 17. Comparison between the MSE (m) of predicted and observed Hs for all SVM Models (Port Said region).
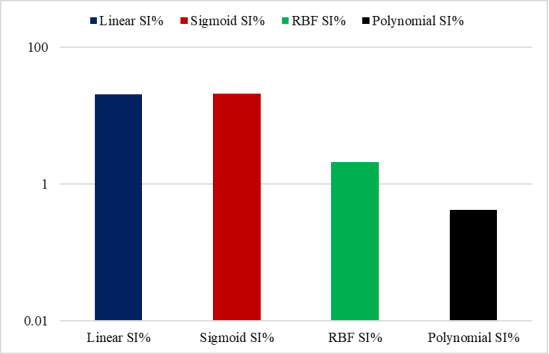
Figure 18. Comparison between the SI (%) of predicted and observed Hs for all SVM Models (Port Said region).
Finally, employing SVM models with RBF and Polynomial Kernels can substantially reduce the overall errors in the results.
5.2. Parametric Models
The correlation factors listed in Table 2 indicated that all parametric models have a strong correlation between the predicted and observed values, however, the P-M model has the best correlation value (R = 0.999).
Figures 19 to 24 illustrate the correlation charts of parametric models. It is obvious from Figures 19 and 22 that most of the predicted and observed Hs values lie on the diagonal Fit line, which indicates that the P-M model works excellently with all data of the study area. On the other hand, SPM and CEM models work well in the Alexandria region up to Hs ≤ 4.0 m (Figures 20 and 21), while they work well in the Port Said region up to Hs ≤ 3.0 m (Figures 23 and 24). However, they still cover high ranges of the Hs of the study area (more than 95% of the wave data).
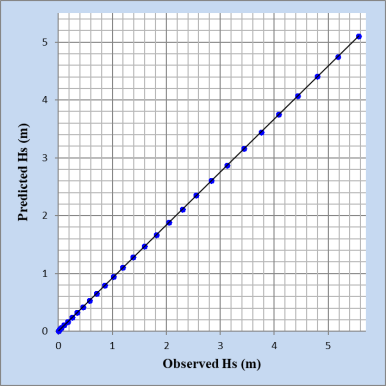
Figure 19. Correlation of Predicted and Actual Hs, P-M Model for Alexandria region.
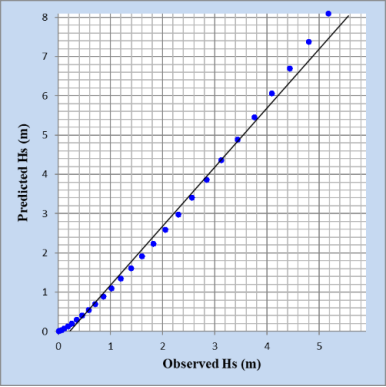
Figure 20. Correlation of Predicted and Actual Hs, SPM Model for Alexandria region.
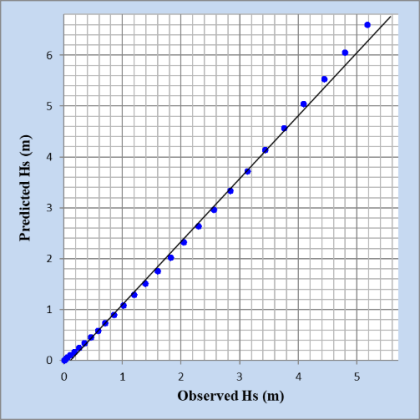
Figure 21. Correlation of Predicted and Actual Hs, CEM Model for Alexandria region.
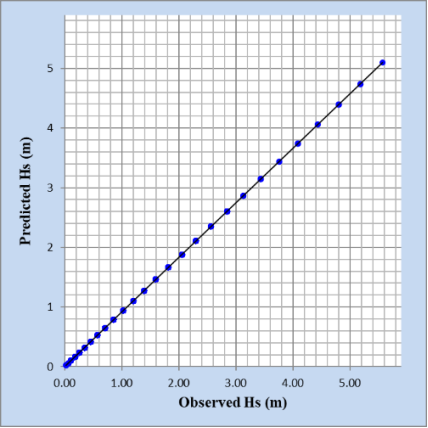
Figure 22. Correlation of Predicted and Actual Hs, P-M Model for Port Said region.
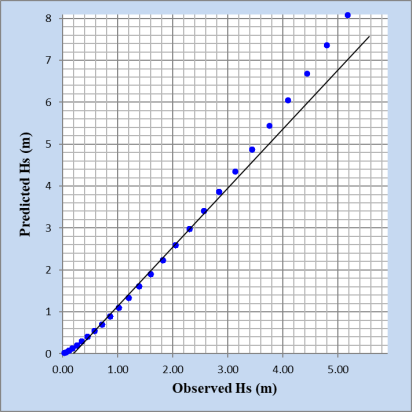
Figure 23. Correlation of Predicted and Actual Hs, SPM Model for Port Said region.
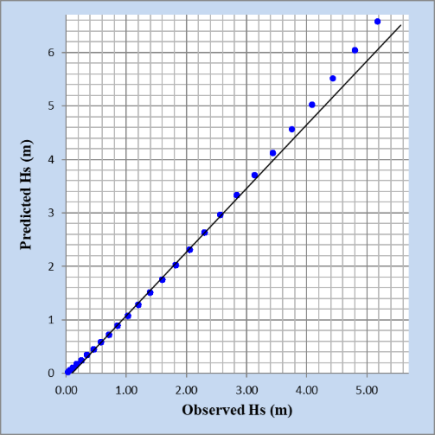
Figure 24. Correlation of Predicted and Actual Hs, CEM Model for Port Said region.
Moreover, the results in Table 2 confirmed that the P-M model was the most accurate in its results among all parametric models, as the MSE and SI % values were 0.02 m and 12.30 % in the Alexandria region, respectively, while were 0.01 m and 11.40 % in the Port Said region, respectively.
It is also noted that the CEM model gave satisfactory results, as the MSE and SI were equal to 0.07 m and 22.70 %, respectively, for the Alexandria region, while they were equal to 0.02 m and 15.10 %, respectively, for the Port Said region (Table 2). In addition, the SPM model has the lowest performance among all the parametric models used in this study, as the MSE and SI were equal to 0.31 m and 43.20 %, respectively, for the Alexandria region, while in the Port Said region were equal to 0.09 m and 29.60 %, respectively, (Table 2).
Finally, Figures 25 to 28 display a comparison between the results of parametric models for Alexandria and Port Said regions, as the advantage of the P-M model is clear.
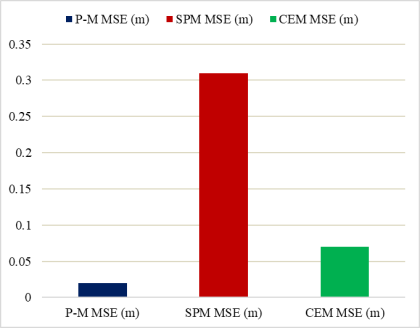
Figure 25. Comparison between the MSE (m) of predicted and observed Hs for all Parametric Models (Alexandria region).
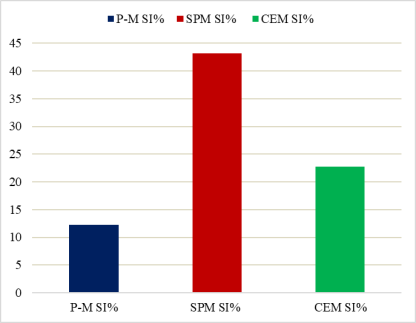
Figure 26. Comparison between the SI (%) of predicted and observed Hs for all Parametric Models (Alexandria region).
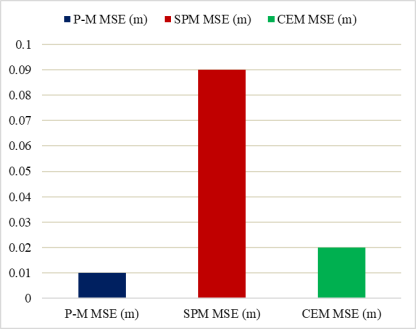
Figure 27. Comparison between the MSE (m) of predicted and observed Hs for all Parametric Models (Port Said region).
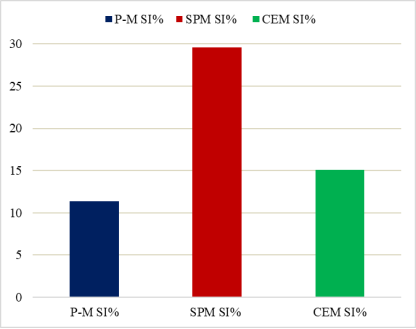
Figure 28. Comparison between the SI (%) of predicted and observed Hs for all Parametric Models (Port Said region).
5.3. Comparison Between SVM and Parametric Models
According to the previous indices, the SVM models (RBF and Polynomial Kernels) are the best among all models used in this study (i.e. Parametric and other SVM models). This means that SVM models (RBF and Polynomial) are capable of predicting significant wave heights for different ranges, since they have fewer free parameters to optimize, and can be easily specified .
Figures 7 to 10 and 20 to 24 confirmed that the parametric (SPM and CEM) models outperformed the SVM (Linear and Sigmoid) models, as they gave excellent performance that covered wider ranges of Hs values than the SVM (Linear and Sigmoid) models. Moreover, the performance of the parametric model (P-M) is close to the SVM models (RBF and Polynomial), which confirms that the parametric models are still promising in the field of wave height prediction (Tables 1 and 2). All these models have the same correlation factor (0.999), as they have high performance with all values of Hs (Figures 11 to 14, 19, 22).
Table 3 summarizes the statistical errors of the parametric model (P-M) and SVM models (RBF and Polynomial).
Table 3. Summary of statistical errors of the P-M parametric model Vs. the SVM models based on RBF and Polynomial Kernels.

Parametric/SVM Models

Alexandria Region

Port Said Region

MSE (m)

SI (%)

MSE (m)

SI (%)

P-M (Parametric)

0.02

12.3

0.01

11.4

RBF (SVM)

0.00001

00.25

0.0003

2.10

Polynomial (SVM)

0.001

2.14

0.00001

0.42

Figures 29 to 32 display a comparison of MSE and SI% values between the P-M model and RBF and Polynomial SVM models. It is obvious that the RBF and Polynomial models outperformed the P-M model in their performance.
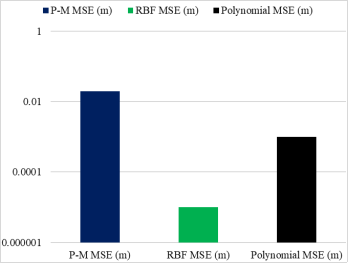
Figure 29. Comparison between the MSE (m) of predicted and observed Hs for P-M, RBF and Polynomial models (Alexandria region).
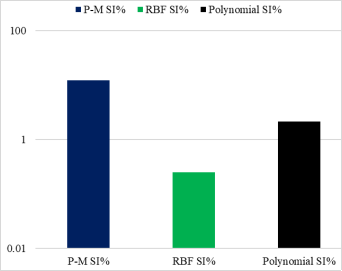
Figure 30. Comparison between the SI (%) of predicted and observed Hs for P-M, RBF and Polynomial models (Alexandria region).
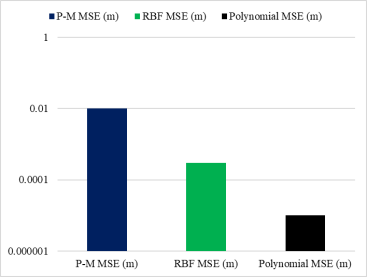
Figure 31. Comparison between the MSE (m) of predicted and observed Hs for P-M, RBF and Polynomial models (Port Said region).
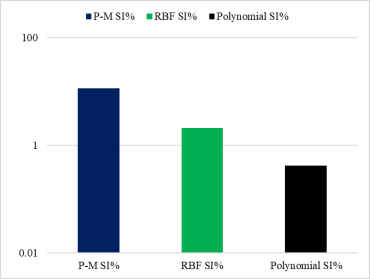
Figure 32. Comparison between the SI (%) of predicted and observed Hs for P-M, RBF and Polynomial models (Port Said region).
6. Conclusions
Support Vector Machine is one of the effective machine-learning techniques based on the principle of error minimization, which can generally eliminate overfitting training and local minima. The SVM models are implemented in this study to predict significant wave heights. These models are used with different Kernel functions (Linear, Sigmoid, Radial Basis Function, and Polynomial) to find the most suitable ones. The SVM results are compared with the field data and with the results of parametric models. It was found that the SVM models (RBF and Polynomial) provide lower prediction error than other models. In addition, the SVM models (Linear and Sigmoid) did not perform well with Hs values more than 2.5 m, as they gave poor accuracy in their results (15% to 35% increase in predicted Hs values compared to observed values of Hs). Also, the results obtained from the parametric model (P-M) were close to the results of SVM models (RBF and Polynomial), which confirms that the parametric models will remain reliable models in predicting significant wave heights.
In conclusion, the SVM models based on RBF and Polynomial were more accurate in their results than the other models with all wave height ranges, as they provided the best generalization performance. Therefore, it can be said that SVM models (RBF and Polynomial) are promising techniques and can be an alternative to other models used in the field of wave height prediction.
Abbreviations

FIS

Fuzzy Inference System

ANN

Artificial Neural Network

CART

Classification and Regression Tree

ANFIS

Adaptive Network Based Fuzzy Inference System

GP

Genetic Programming

SVM

Support Vector Machine

MLP

Multi-Layer Perceptron

RBF

Radial Basis Function

GA

Genetic Algorithm

LR

Linear Regression

P-M

Pierson-Moskowitz

SPM

Shore Protection Manual

JONSWAP

Joint North Sea Wave Project

CEM

Coastal Engineering Manual

S4DW

S4 Directional Wave

NW

North-West

MSE

Mean Square Error

SI

Scatter Index

Acknowledgments
The authors would like to express their deep gratitude to the Egyptian Navy, Meteorological and Oceanographic Division, for their support in providing the datasets used in this study.
Author Contributions
Hassan Salah: Conceptualization, Data curation, Formal Analysis, Investigation, Methodology, Supervision, Writing – original draft
Mohamed Elbessa: Conceptualization, Methodology, Resources, Validation, Visualization, Writing – review & editing
Conflicts of Interest
The authors declare no conflicts of interest.
References
[1] Günaydin, K. The estimation of monthly mean significant wave heights by using artificial neural network and regression methods. Ocean Engineering. 2008, 35(14-15), 1406–1415.
[2] Salah, H. Prediction of wave parameters off the Nile delta coast of Egypt using nonlinear regression analysis. International Journal of Science and Research (IJSR). 2017, 6(9), 187-195.
[3] Vapnik, V. N. The Nature of Statistical Learning Theory. Springer, New York. 1ST Edition 1995, 188pp.
[4] Browne, M., Castelle, B., Strauss, D., Tomilnson, R., Blumenstein, M., and Lane, C. Near-shore swell estimation from a global wind–wave model: spectral process, linear and artificial neural network models. Coastal Eng. 2007, 54(5), 445–460.
[5] Mahjoobi, J. and Mosabbeb, E. A. Prediction of significant wave height using regressive support vector machines. Ocean Engineering. 2009, 36(5), 339–347.
[6] Deo, M. C. and Naidu, C. S. Real time wave forecasting using neural networks. Ocean Engineering. 1998, 26(3), 191–203.
[7] Agrawal, J. D. and Deo, M. C. Wave parameter estimation using neural networks. Marine Structures. 2004, 17(7), 536–550.
[8] Makarynskyy, O. Improving wave predictions with artificial neural networks. Ocean Engineering. 2004, 31(5–6), 709–724.
[9] Kazeminezhad, M. H., Etemad-Shahidi, A., and Mousavi, S. J. Application of fuzzy inference system in the prediction wave parameters. Ocean Engineering. 2005, 32(14-15), 1709–1725.
[10] Makarynskyy, O., Pires-Silva, A. A., Makarynska, D., and Ventura-Soares, C. Artificial neural networks in wave predictions at the west coast of Portugal. Computers & Geosciences. 2005, 31(4), 415–424.
[11] Mao, M., Zhou, X. B., Pi, D. Y., Sun, Y. X., and Wong, S. T. Parameters selection in gene selection using Gaussian kernel support vector machines by genetic algorithm. Journal of Zhejiang University Science. 2005, 6(10), 961–973.
[12] Ozger, M. and Sen, Z. Prediction of wave parameters by using fuzzy logic approach. Ocean Engineering. 2007, 34(3-4), 460–469.
[13] Mahjoobi, J., Etemad-Shahidi, A., and Kazeminezhad, M. H. Hindcasting of wave parameters using different soft computing methods. Applied Ocean Research. 2008, 30(1), 28–36.
[14] Gaur, S. and Deo, M. C. Real-time wave forecasting using genetic programming. Ocean Engineering. 2008, 35(11-12), 1166–1172.
[15] Tsai, J. C. and Tsai, C. H. Wave measurements by pressure transducers using artificial neural networks. Ocean Engineering. 2009, 36(15-16), 1149–1157.
[16] Etemad-Shahidi, A., and Mahjoobi, J. Comparison between M5’ model tree and neural networks for prediction of significant wave height in Lake Superior. Ocean Engineering. 2009, 36(15-16), 1175–1181.
[17] Patil, S. G., Mandal, S., and Hegde, A. V. Genetic Algorithm based support vector machine regression in predicting wave transmission of horizontally interlaced multi-layer moored floating pipe breakwater. Elsevier. 2012, 45(1), 203–212.
[18] Delavari, E., Gharabaghi, A. R. M., and Chenaghlou, M. R. Application of Artificial Neural Network and Fuzzy Inference System in Prediction of Breaking Wave Characteristics. Journal of the Persian Gulf, Marine Science. 2013, 4(13), 47-60.
[19] Sathiya, R. D., Vaithiyanathan, V., and Venkataram, G. B. Neural Modelling for Critical Wave Heights in Coastal Regions in Tamil Nadu. World Applied Sciences Journal. 2014, 29, 126-132.
[20] Elgohary, T., Mubasher, A., and Salah, H. Significant deep wave height prediction by using support vector machine approach (Alexandria as case of study), International Journal of Current Engineering and Technology (IJCET). 2017, 7(1), 135-143.
[21] Tom, T. H. A., Ikemoto, A., Mase, H., Kim S., Takeda, M., and Kawasaki, K. One year verification of wave predictions by deep learning using Xception. 2020, 76(2), 1213-1218.
[22] Afzal, M. S., Kumar, L., Chugh, V., Kumar, Y., and Zuhair, M. Prediction of significant wave height using machine learning and its application to extreme wave analysis. Journal of Earth System Science. 2023, 132, 51, 1-17.
[23] Ben-Hur, A., Weston, J. A. User’s Guide to Support Vector Machines. Data Mining Techniques for the Life Sciences. 2009, 223–239.
[24] Boser, B. E., Guyon, I., and Vapnik, V. N. A training algorithm for optimal margin classifiers. Proceedings of the Fifth Annual Workshop on Computational Learning Theory. 1992, 144–152.
[25] Hsu, C. W.; Chang, C. C., and Lin, C. J. A Practical Guide to Support Vector Classification. Department of Computer Science, National Taiwan University, 2010, Taipei 106, Taiwan.
[26] Pierson, W. J. and Moskowitz, L. A proposed spectral form for fully developed wind seas based on the similarity theory of S. A. Kitaigorodskii. Journal of Geophysical Research. 1964, 69(24), 5181–5190.
[27] U. S. Army Corps of Engineers. Shore Protection Manual, Volume I. Coastal Engineering Research Center. Department of the Army, Waterways Experiment Station, Corps of Engineers, Vicksburg, Mississippi 39180; 1984, 337p.
[28] U. S. Army Corps of Engineers. Meteorology and Wave Climate. In: Coastal Engineering Manual, 1110-2-1100. Washington, DC 20314-1000, 2008, 72 pp.
[29] Salah, H. Evaluate the prediction of wave parameters using parametric methods in the south coast of the Mediterranean Sea. International Journal of Science and Research (IJSR). 2017, 6(10), 1917-1923.
[30] World Meteorological Organization. Guide to wave analysis and forecasting. WMO No. 702, Secretarial of World Meteorological Organization, Geneva, Switzerland. 1988, 244 pp.
[31] Ochi, M. K. Stochastic Analysis and Probabilistic Prediction of Random Seas. Advances in Hydroscience. 1982, 13, 217–375.
[32] Hasselmann, K.; Barnett T. P.; Bouws E.; Carlson D. E.; Cartwright D. E.; Enke K.; Ewing J. A.; Gienapp H.; Hasselmann D. E.; Kruseman P.; Meerburg A.; Muller P.; Olbers D. J.; Richter K.; Sell W., and Walden H. Measurements of Wind Wave Growth and Swell Decay during the Joint North Sea Wave Project (JONSWAP). Deutsches Hydrographische Zeitschrift. 1973, 8(12), 94pp.
[33] Younes, M. A. A. Natural Gas Geochemistry in the Offshore Nile Delta, Egypt. Chapter 2, Advances in Petrochemicals Textbook. IntechOpen. 2015, 27-40.
[34] Cherkassky, V. and Ma, Y. Practical selection of SVM parameters and noise estimation for SVM regression. Neural Networks. 2004, 17(1), 113–126.
[35] Yu, P. S.; Chen, S. T., and Chang, I. F. Support vector regression for real-time flood stage forecasting. Journal of Hydrology. 2006, 328(3-4), 704–716.
Cite This Article
  • APA Style

    Salah, H., Elbessa, M. (2024). Using Machine Learning Techniques to Predict Significant Wave Height Compared with Parametric Methods. Engineering and Applied Sciences, 9(5), 106-128. https://doi.org/10.11648/j.eas.20240905.12

    Copy | Download

    ACS Style

    Salah, H.; Elbessa, M. Using Machine Learning Techniques to Predict Significant Wave Height Compared with Parametric Methods. Eng. Appl. Sci. 2024, 9(5), 106-128. doi: 10.11648/j.eas.20240905.12

    Copy | Download

    AMA Style

    Salah H, Elbessa M. Using Machine Learning Techniques to Predict Significant Wave Height Compared with Parametric Methods. Eng Appl Sci. 2024;9(5):106-128. doi: 10.11648/j.eas.20240905.12

    Copy | Download

  • @article{10.11648/j.eas.20240905.12,
      author = {Hassan Salah and Mohamed Elbessa},
      title = {Using Machine Learning Techniques to Predict Significant Wave Height Compared with Parametric Methods
    },
      journal = {Engineering and Applied Sciences},
      volume = {9},
      number = {5},
      pages = {106-128},
      doi = {10.11648/j.eas.20240905.12},
      url = {https://doi.org/10.11648/j.eas.20240905.12},
      eprint = {https://article.sciencepublishinggroup.com/pdf/10.11648.j.eas.20240905.12},
      abstract = {Prediction of Sea Wave parameters is an important issue as it is the main design factor for maritime structures. Previously, researchers have used many parametric and numerical approaches, which may be complex in application, take a long time in preparation and sometimes require a bathymetric survey. Recently, soft computing techniques such as Fuzzy Inference Systems, Genetic Algorithm, Machine Learning, etc. have been used to predict sea wave parameters in many marine areas around the world. The ease of application, high accuracy and low computational time of these techniques make them a very good choice in many engineering applications. This study focuses on prediction of significant wave height (Hs) by applying one of the most advanced Machine Learning techniques known as Support Vector Machine (SVM). SVM models are built on the basis of different Kernel functions (Linear, Sigmoid, Radial Basis Function, and Polynomial) which transform the input data into an n-dimensional space where a hyperplane can be generated to partition the data. The results of SVM models are analyzed, evaluated and then compared with the results of commonly used parametric models (P-M, SPM, and CEM). This study shows that the P-M model has reliable and satisfactory results among all parametric models, as its statistical errors are close to those of SVM models (RBF and Polynomial), while all of them are identical in their correlation factors (0.999). Moreover, the parametric models (SPM and CEM) are more accurate in their results than the SVM models (Linear and Sigmoid). Also, this study confirms that the SVM models (RBF and polynomial) are the most accurate models overall, as they have the best generalization error among all models. Finally, it can be concluded that SVM models (RBF and Polynomial) are a promising technique in the sea wave height prediction and can be used as an economic and accurate alternative solution to other prediction models.
    },
     year = {2024}
    }
    

    Copy | Download

  • TY  - JOUR
    T1  - Using Machine Learning Techniques to Predict Significant Wave Height Compared with Parametric Methods
    
    AU  - Hassan Salah
    AU  - Mohamed Elbessa
    Y1  - 2024/10/18
    PY  - 2024
    N1  - https://doi.org/10.11648/j.eas.20240905.12
    DO  - 10.11648/j.eas.20240905.12
    T2  - Engineering and Applied Sciences
    JF  - Engineering and Applied Sciences
    JO  - Engineering and Applied Sciences
    SP  - 106
    EP  - 128
    PB  - Science Publishing Group
    SN  - 2575-1468
    UR  - https://doi.org/10.11648/j.eas.20240905.12
    AB  - Prediction of Sea Wave parameters is an important issue as it is the main design factor for maritime structures. Previously, researchers have used many parametric and numerical approaches, which may be complex in application, take a long time in preparation and sometimes require a bathymetric survey. Recently, soft computing techniques such as Fuzzy Inference Systems, Genetic Algorithm, Machine Learning, etc. have been used to predict sea wave parameters in many marine areas around the world. The ease of application, high accuracy and low computational time of these techniques make them a very good choice in many engineering applications. This study focuses on prediction of significant wave height (Hs) by applying one of the most advanced Machine Learning techniques known as Support Vector Machine (SVM). SVM models are built on the basis of different Kernel functions (Linear, Sigmoid, Radial Basis Function, and Polynomial) which transform the input data into an n-dimensional space where a hyperplane can be generated to partition the data. The results of SVM models are analyzed, evaluated and then compared with the results of commonly used parametric models (P-M, SPM, and CEM). This study shows that the P-M model has reliable and satisfactory results among all parametric models, as its statistical errors are close to those of SVM models (RBF and Polynomial), while all of them are identical in their correlation factors (0.999). Moreover, the parametric models (SPM and CEM) are more accurate in their results than the SVM models (Linear and Sigmoid). Also, this study confirms that the SVM models (RBF and polynomial) are the most accurate models overall, as they have the best generalization error among all models. Finally, it can be concluded that SVM models (RBF and Polynomial) are a promising technique in the sea wave height prediction and can be used as an economic and accurate alternative solution to other prediction models.
    
    VL  - 9
    IS  - 5
    ER  - 

    Copy | Download

Author Information
  • Civil Engineering Department, Faculty of Engineering, Al-Azhar University, Cairo, Egypt; Special Offshore Structures Department, Engineering for the Petroleum and Process Industries Co., Cairo, Egypt

    Biography: Hassan Salah, Ph.D. in Civil Engineering. He works as an "Offshore Engineer, Port and Terminal Section Supervisor" at ENPPI Petroleum Company, Egypt. Before Oil and Gas, he worked 4 years as a Lecturer at Faculty of Engineering (Civil & Ports) as well as 2 years as a site engineer for several mega projects. He has published many papers abroad and participated in many conferences. Areas of interest are Marine Engineering Works, Oil & Gas, Fixed Offshore Platform, Port & Terminals, Jetty, Shore Protection Works, Support Vector Machine, ...etc. http://scholarprofiles.com/Hassan-Salah. https://www.researchgate.net/profile/Hassan-Salah-2

  • Oceanography Department, Faculty of Science, Alexandria University, Alexandria, Egypt

  • Abstract
  • Keywords
  • Document Sections

    1. 1. Introduction
    2. 2. Methodologies
    3. 3. Study Area and Data Used
    4. 4. Results
    5. 5. Discussion
    6. 6. Conclusions
    Show Full Outline
  • Abbreviations
  • Acknowledgments
  • Author Contributions
  • Conflicts of Interest
  • References
  • Cite This Article
  • Author Information